— a private valuation prepared for capital partners —
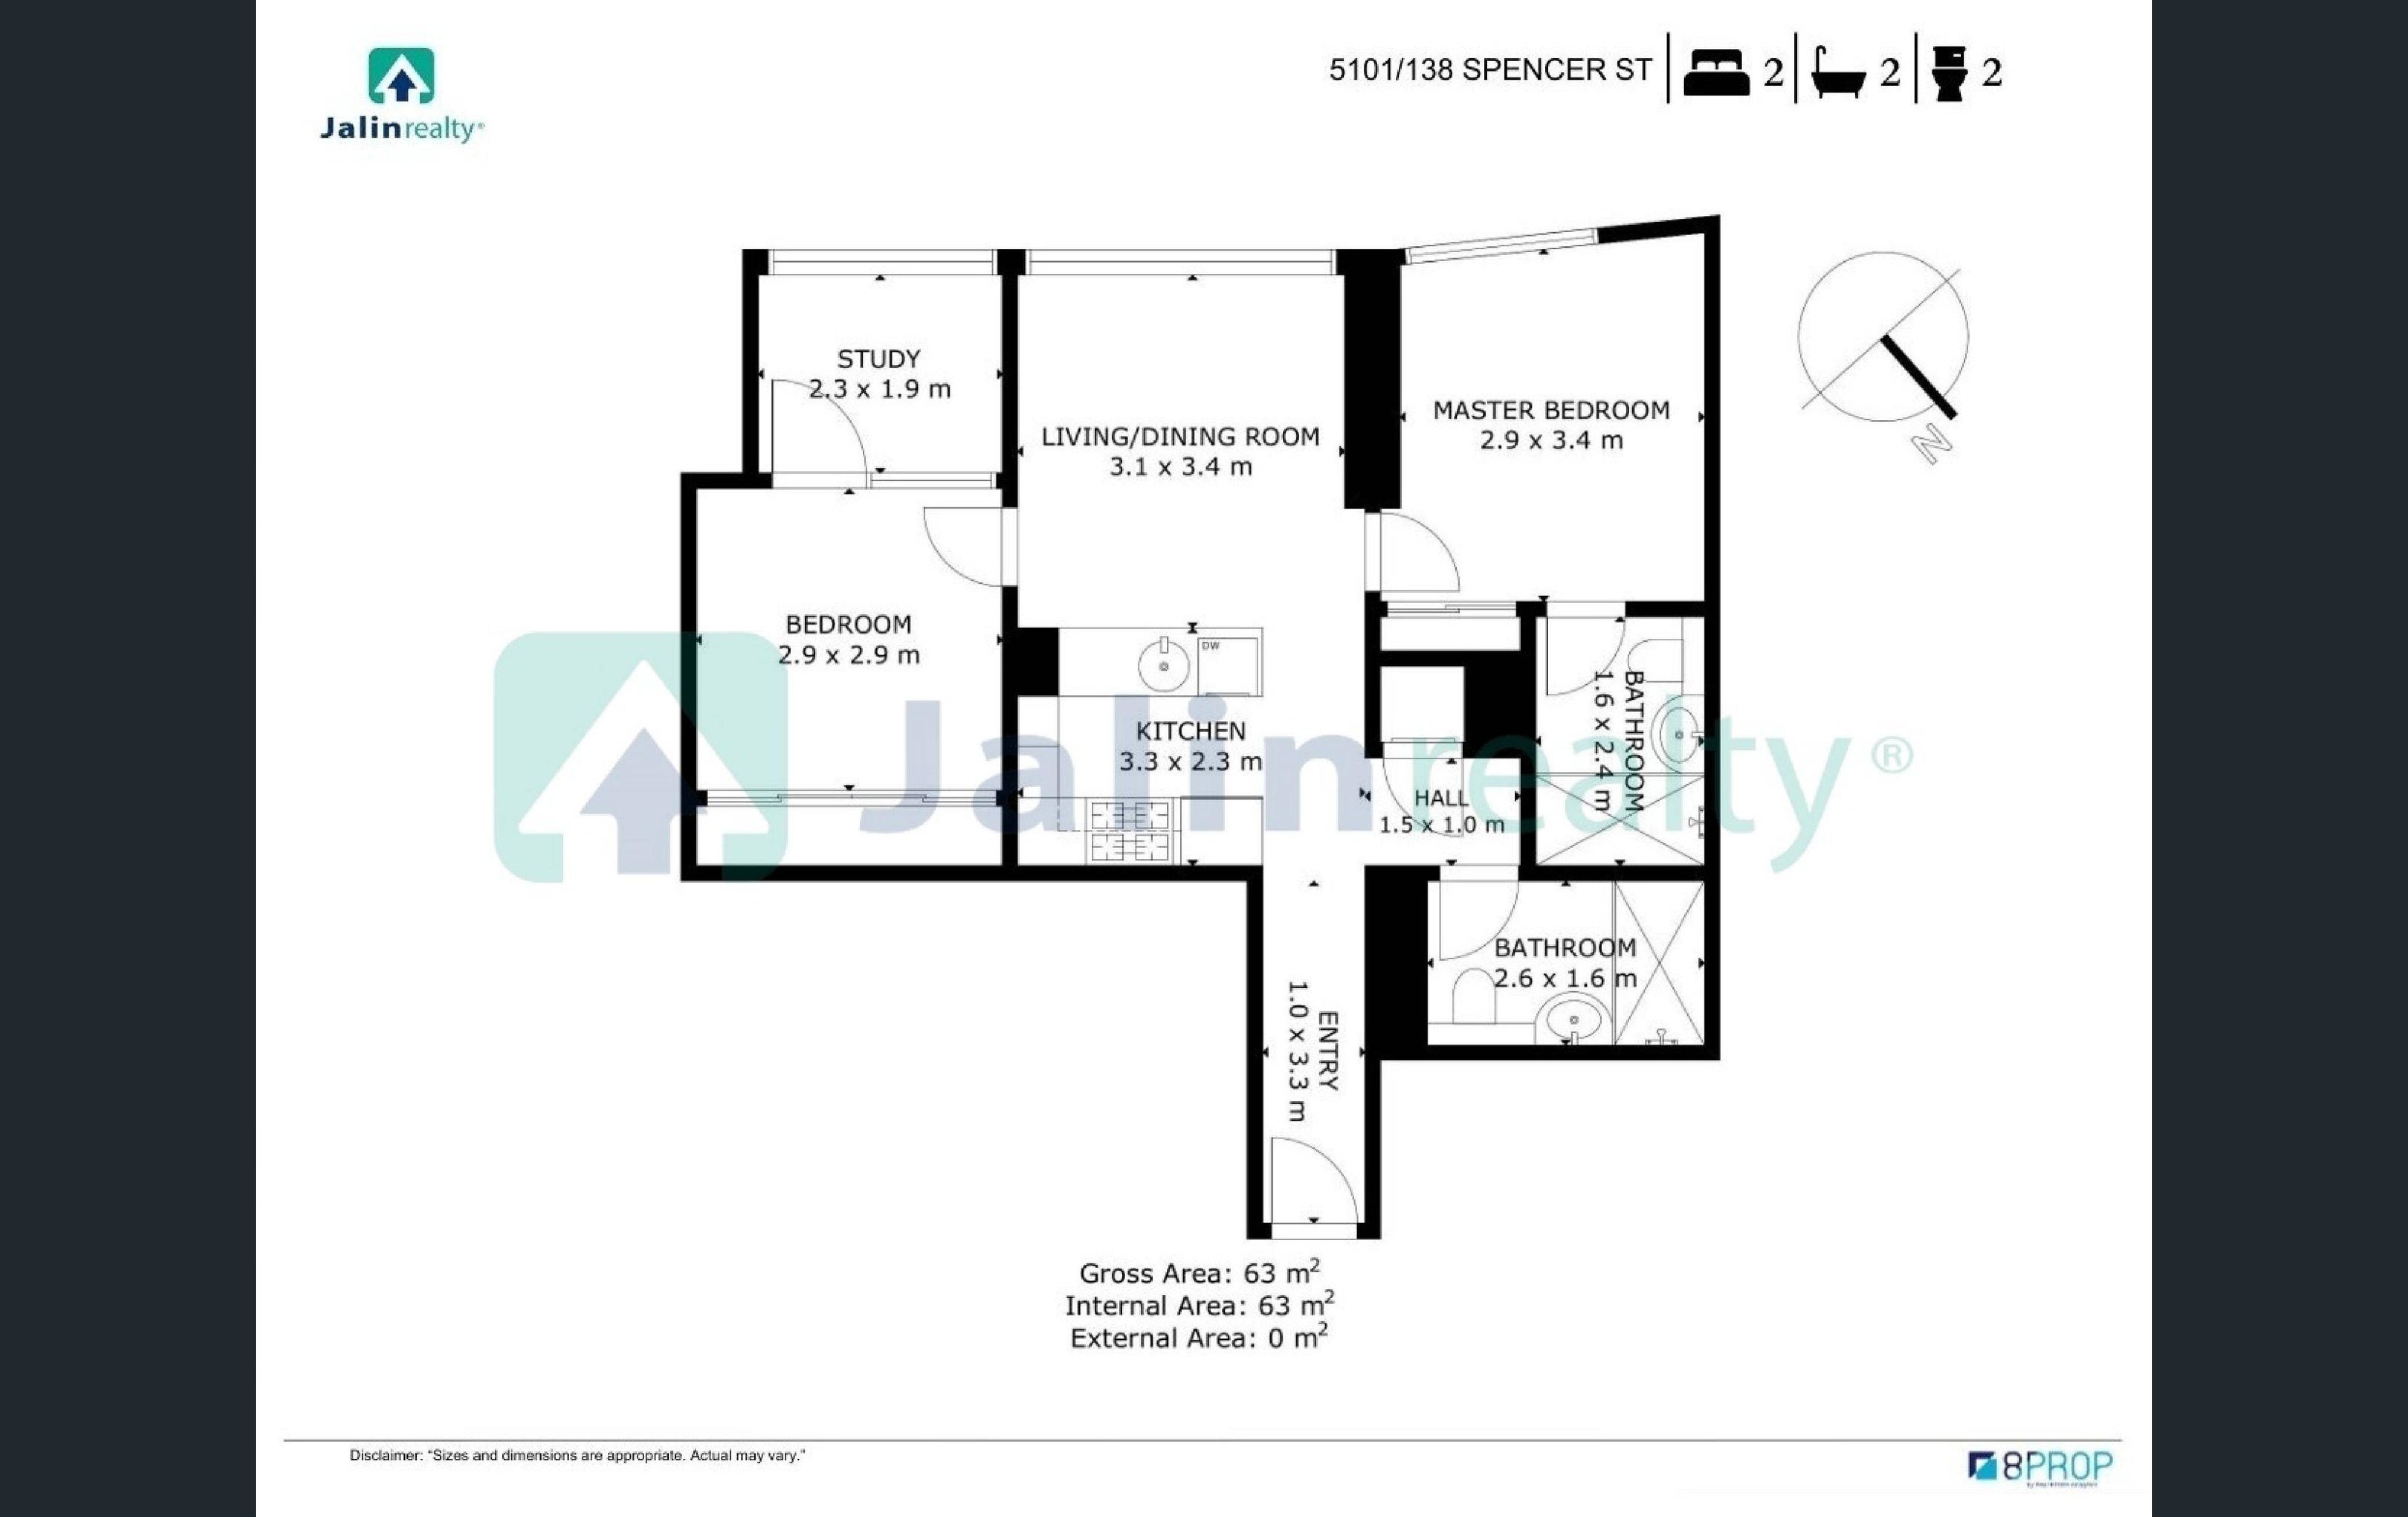
LVL 51·2 BED·2 BATH·0 CAR·63 m²
EXHAUSTIVE
— the upper register · twelve months —
Every recorded sale in the luxury tier (level 39 and above) of Premier Tower between May 2025 and May 2026 from publicly available registers. Forty-seven disposals catalogued. The lower thirty-eight floors are excluded — structurally distinct sub-market, materially higher turnover, lower per-floor pricing — their inclusion in any comparable-sales model would distort the result.
— I —
Position
Premier Tower rises seventy-six storeys above Spencer Street in Melbourne's western central business district. The architectural and pricing midpoint sits at level 38. Everything from level 39 upward forms the upper register — fewer trades, longer holds, materially higher per-floor pricing. Unit 5101 sits at level 51, thirteen floors above midpoint, in the mid-band of this register.
The most apples-to-apples comparators are presumed same-stack units on the "01" line — Unit 5101's exact column. Two such sales settled in the twelve-month window: 7101 (level 71) at $1,069,700 and 3801 (level 38) at $886,800 with a car space. These bracket the subject and anchor the primary estimate. Floorplan equivalence across the "01" line is inferred from unit numbering and is unverified at the cadastral level — see Section VI.
Building Height
76
storeys
Upper Register
L39+
subject sits at L51
Sales Catalogued
47
12 months, top half
Presumed Stack
2
"01" line, inferred
— II —
Visual Reconnaissance
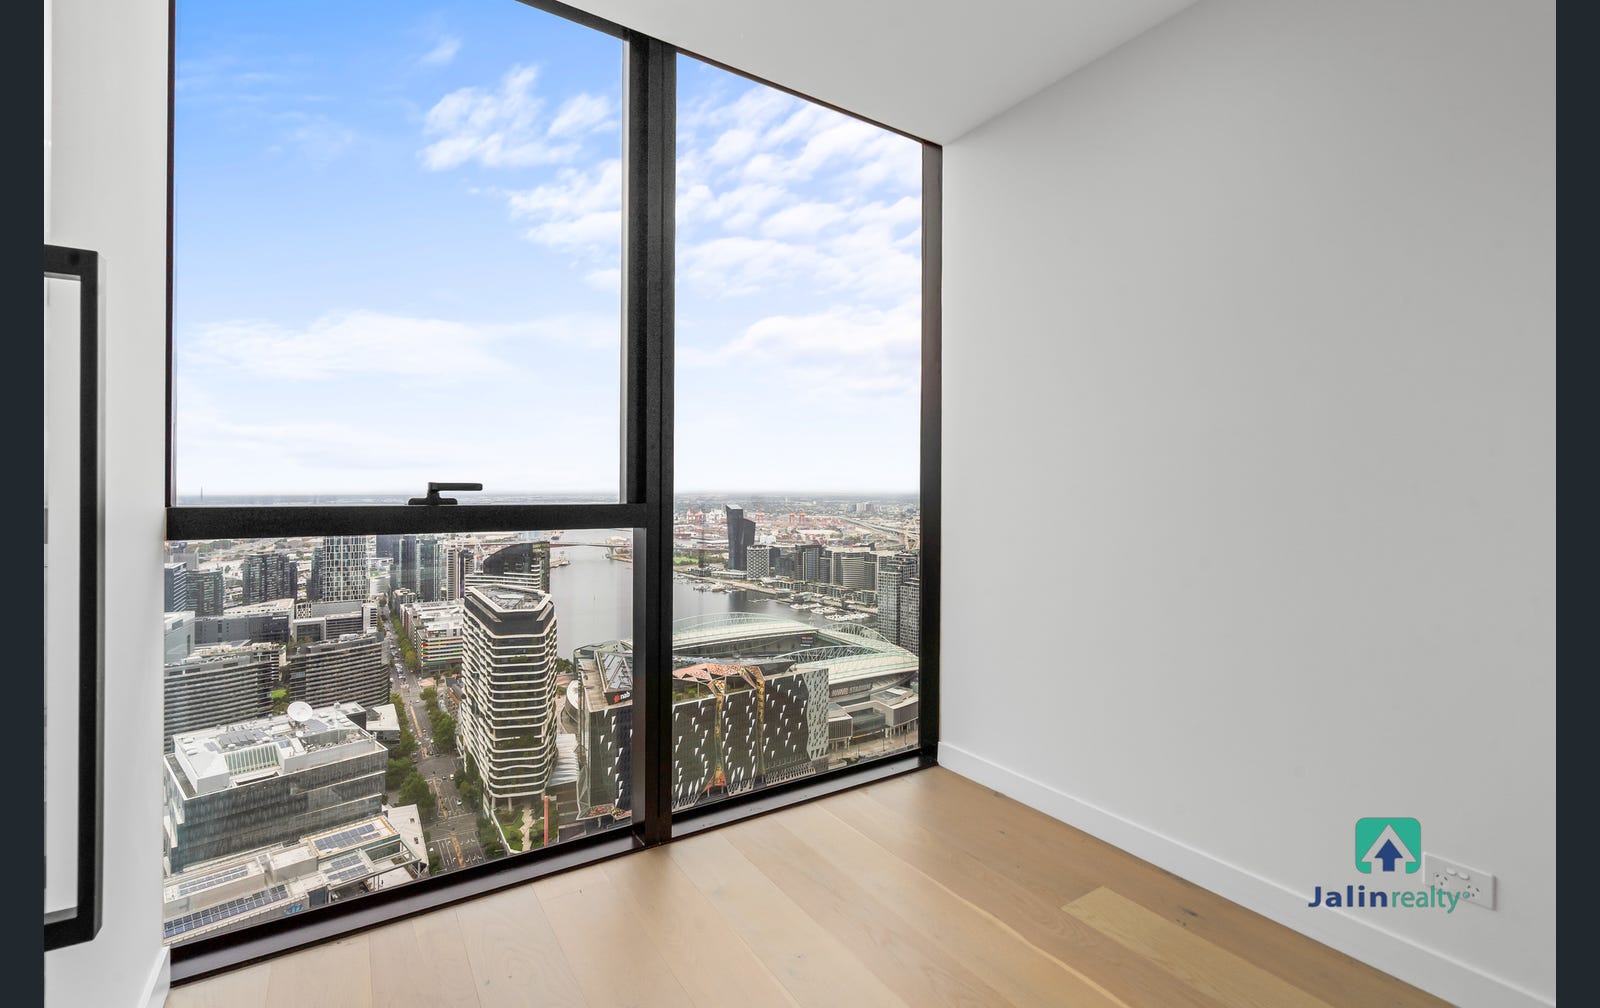
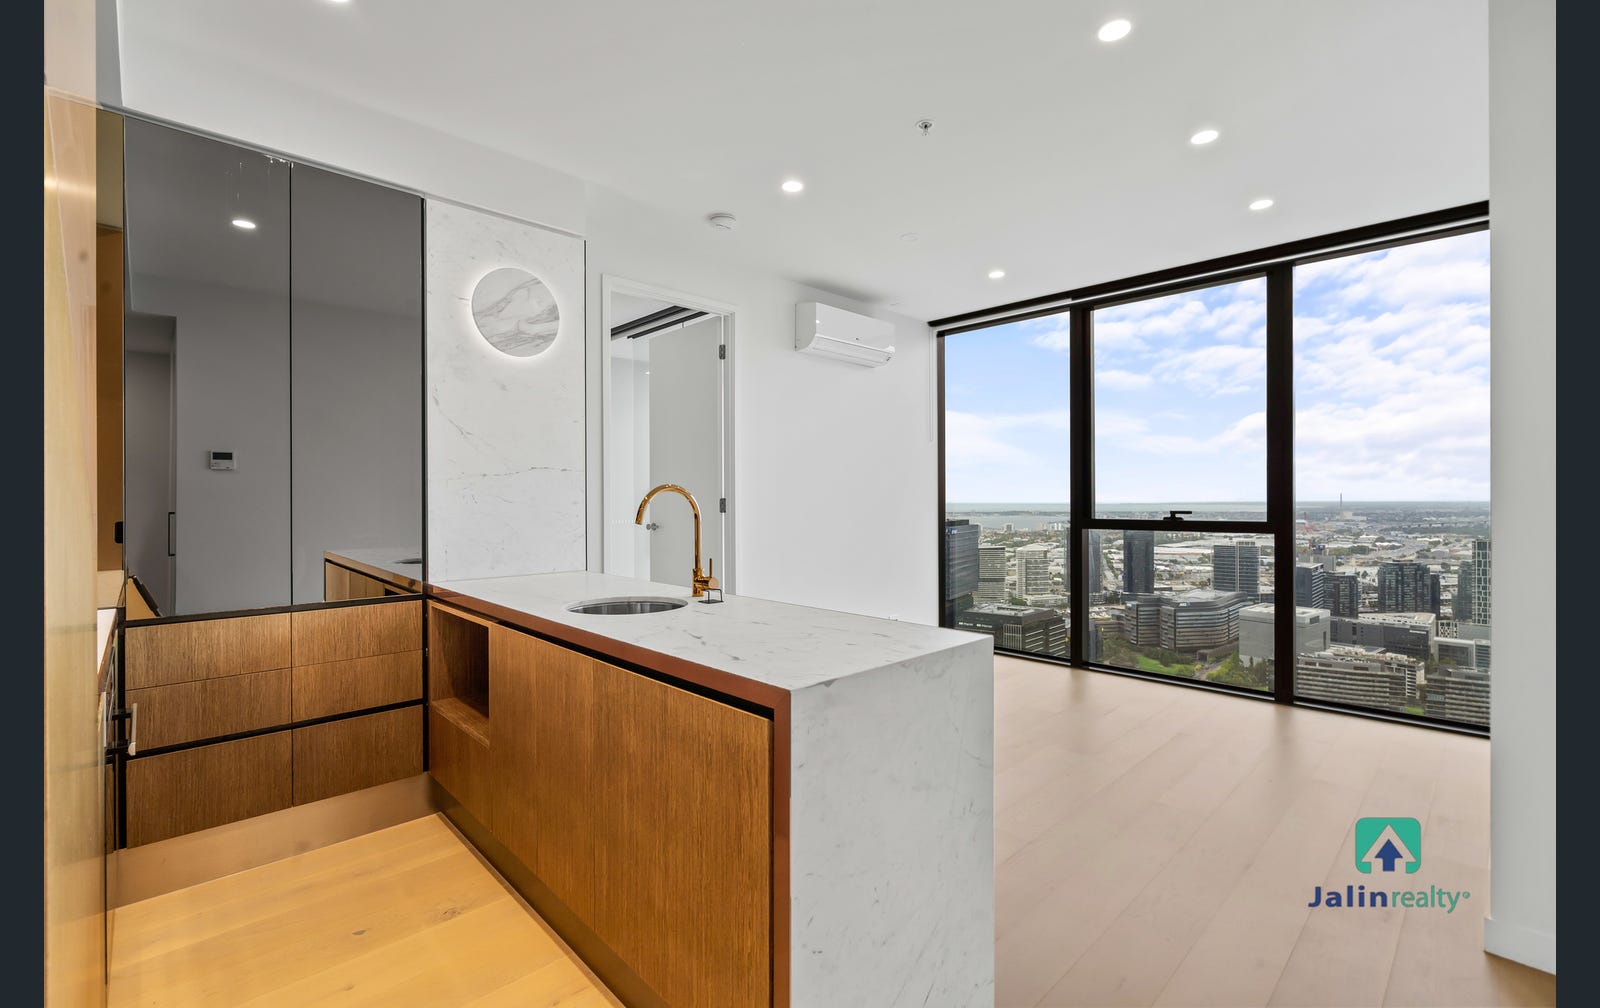
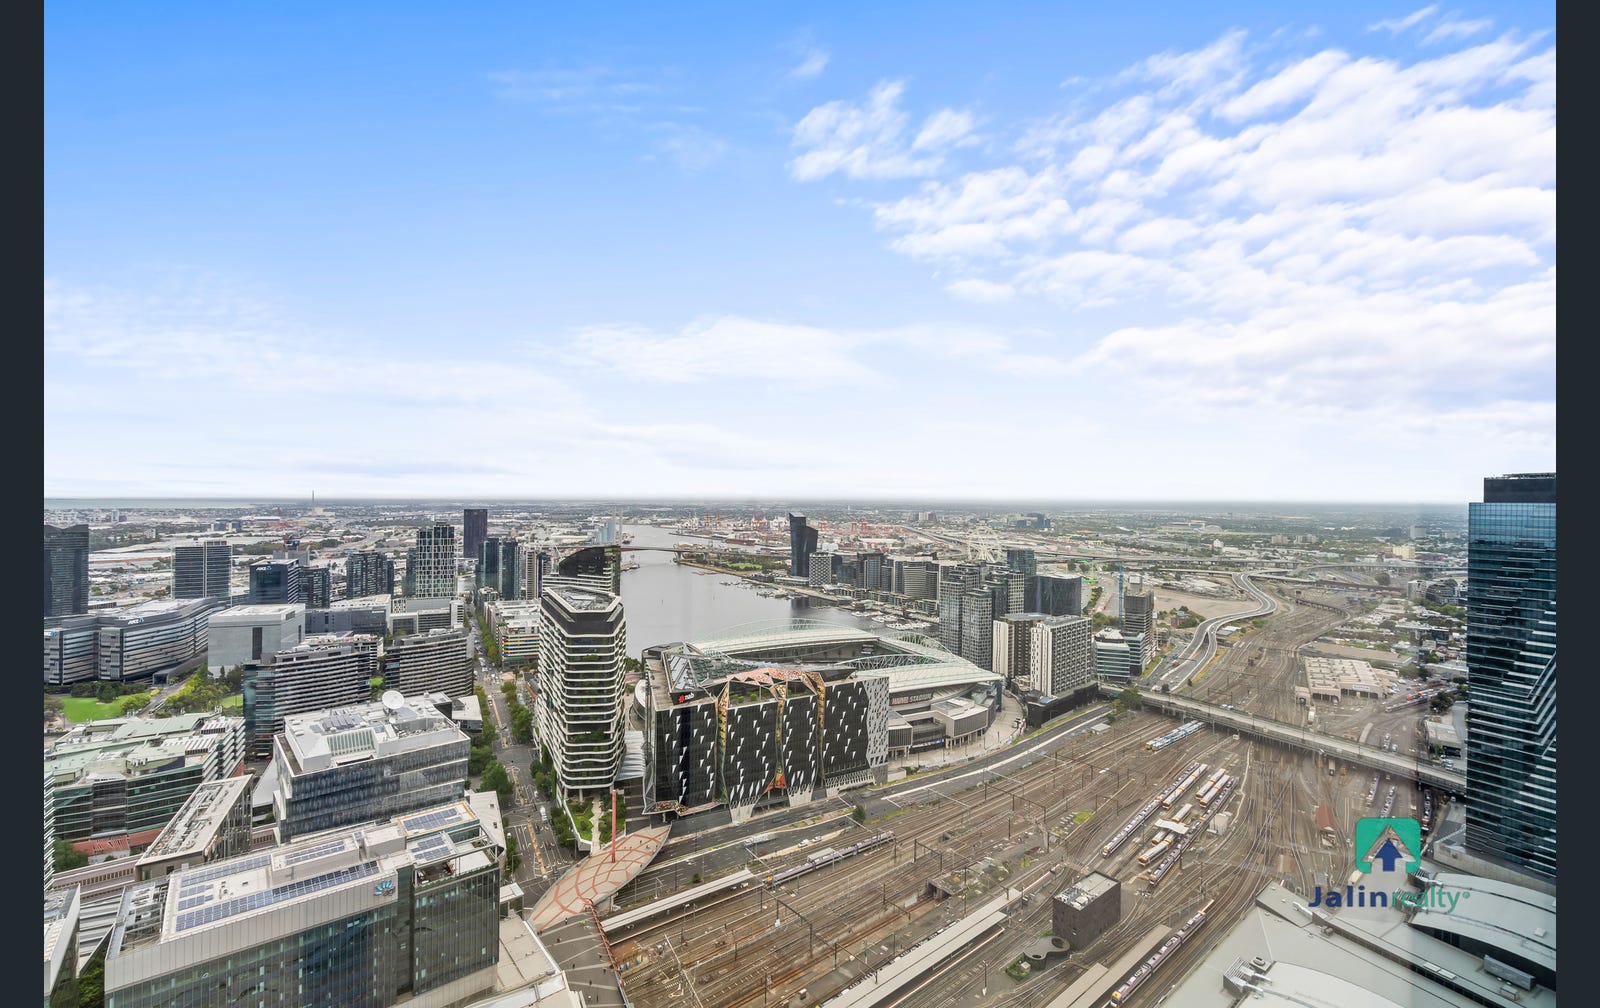
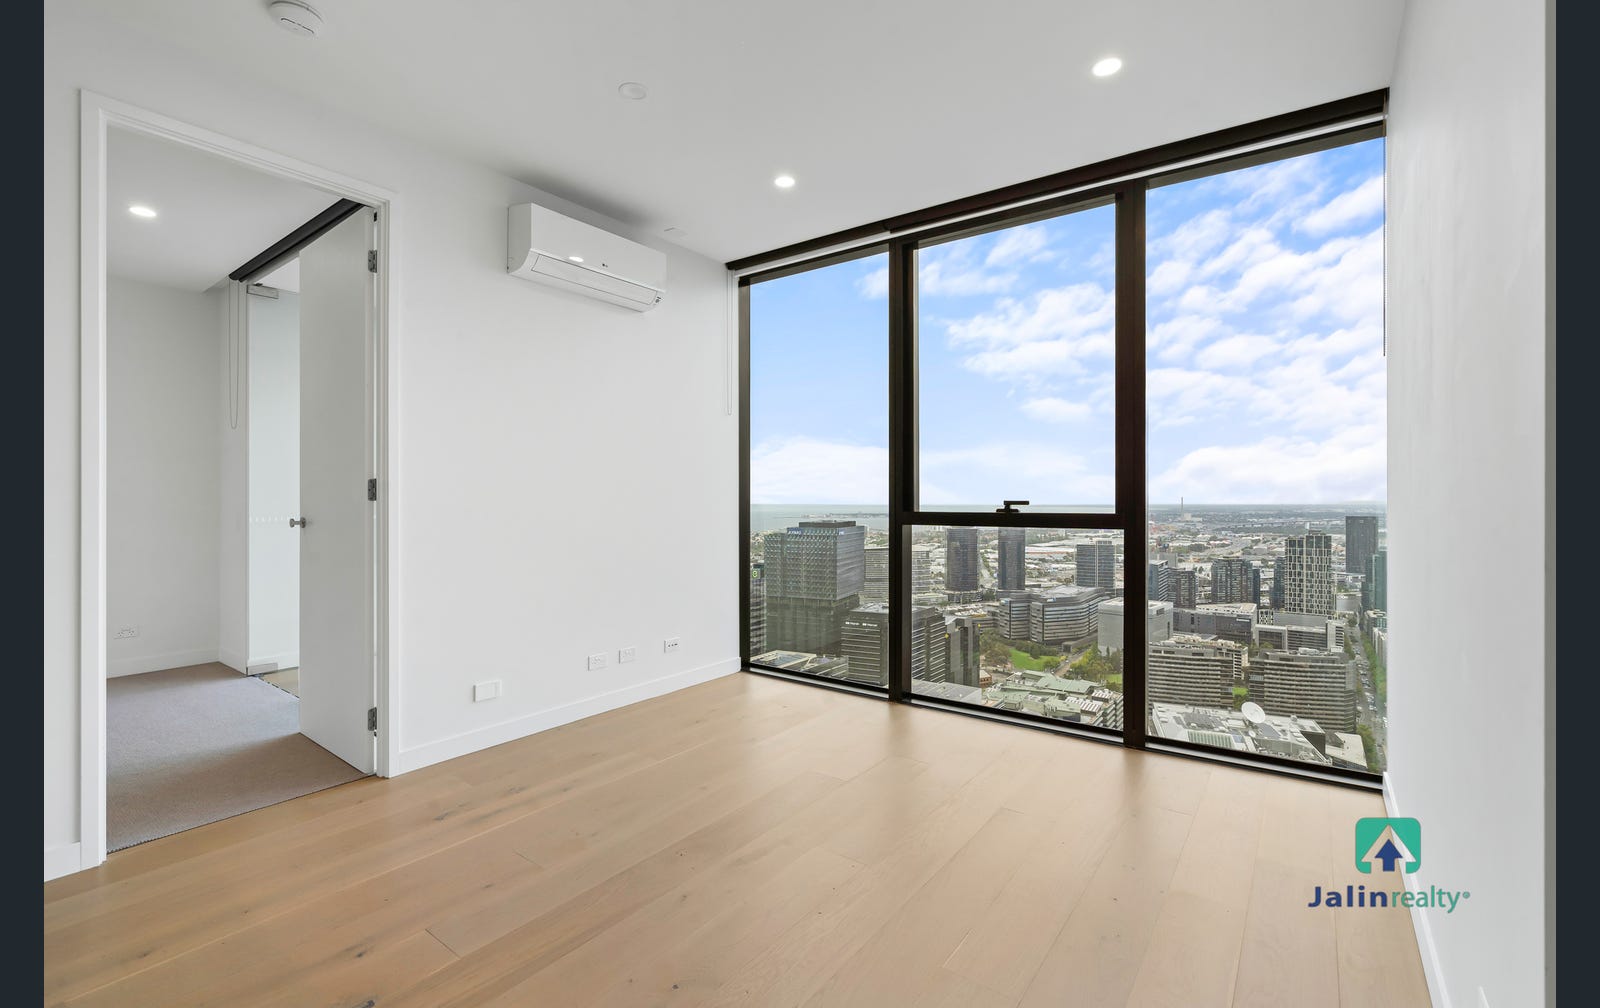
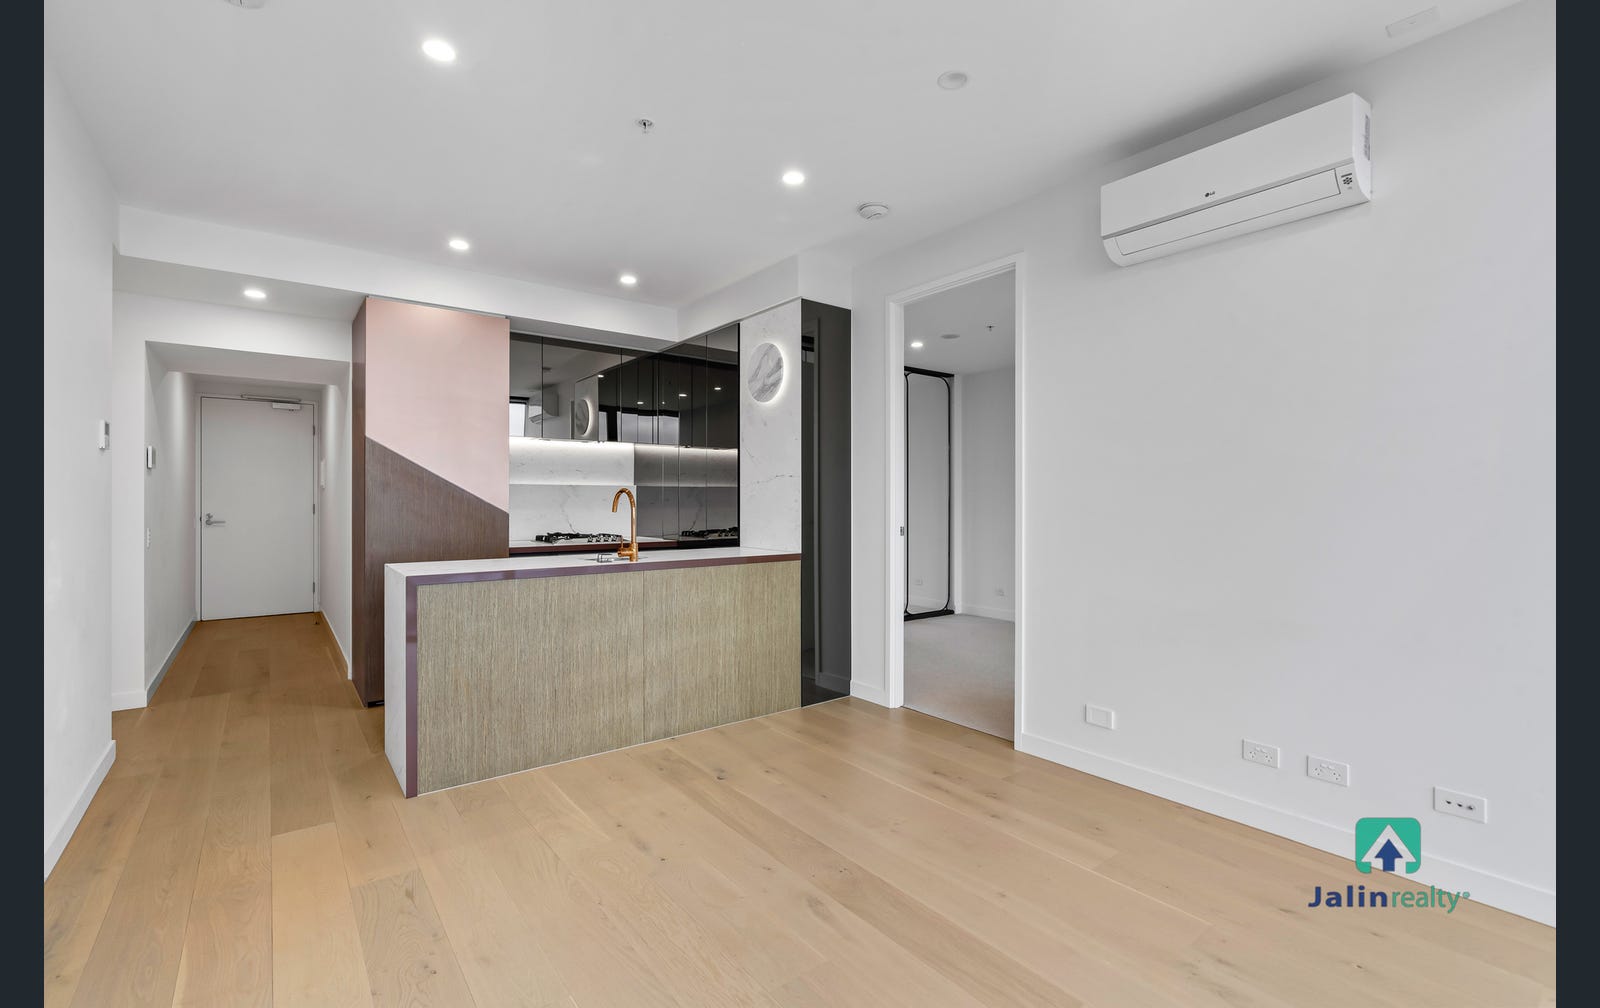
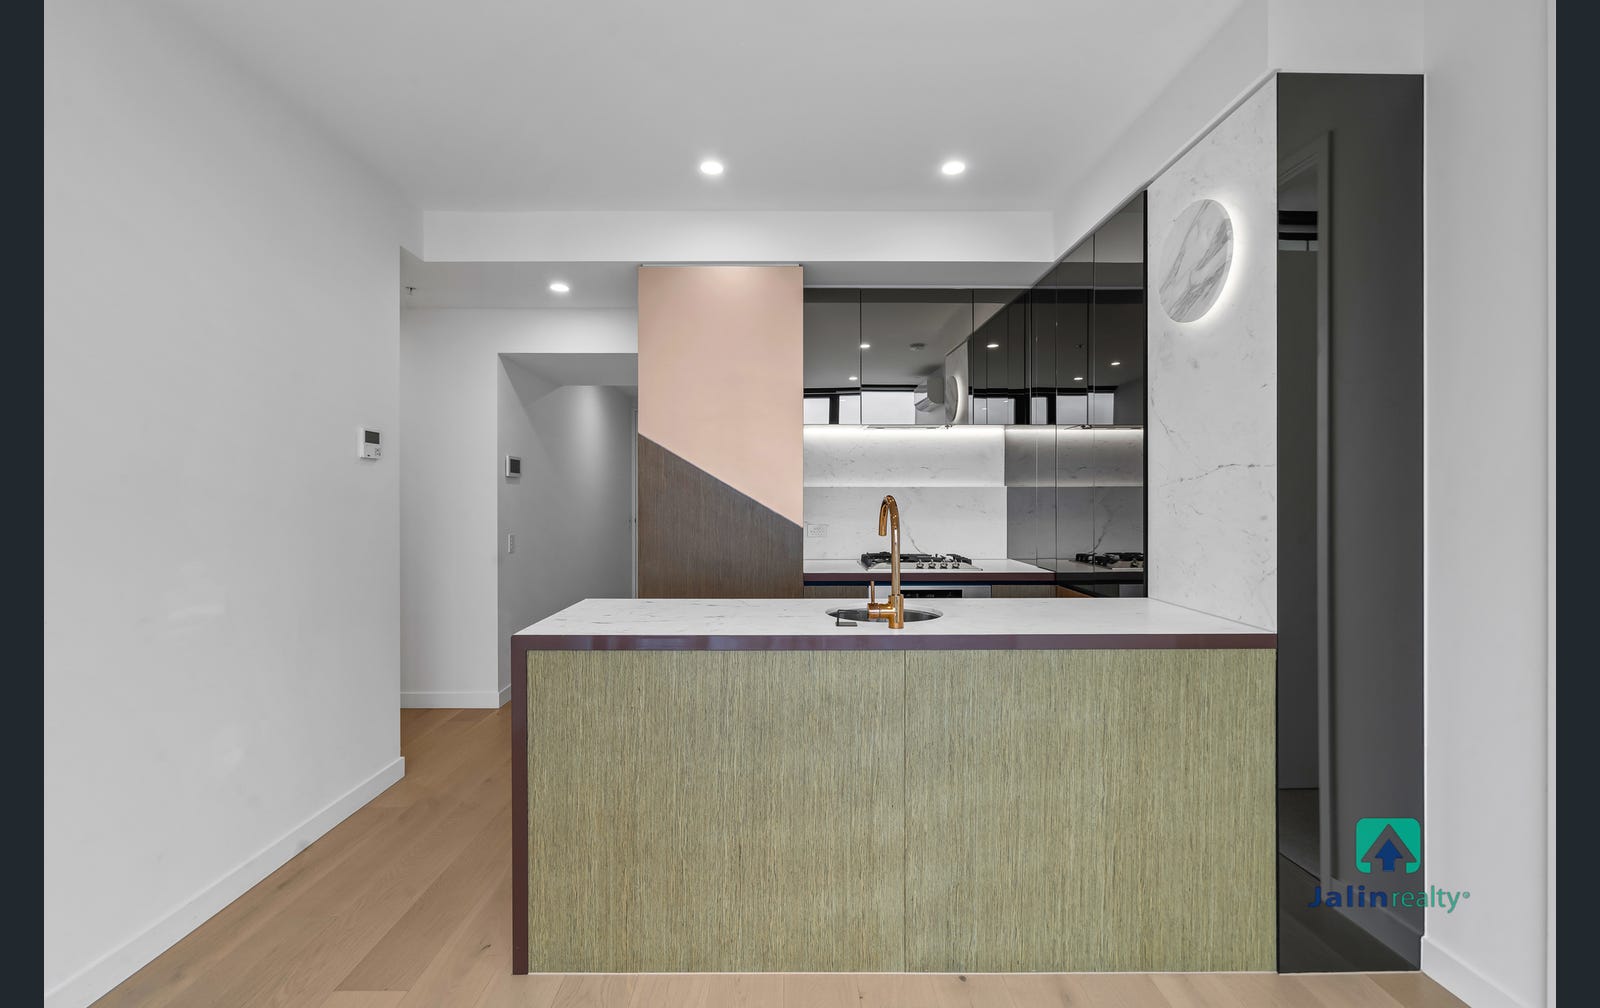
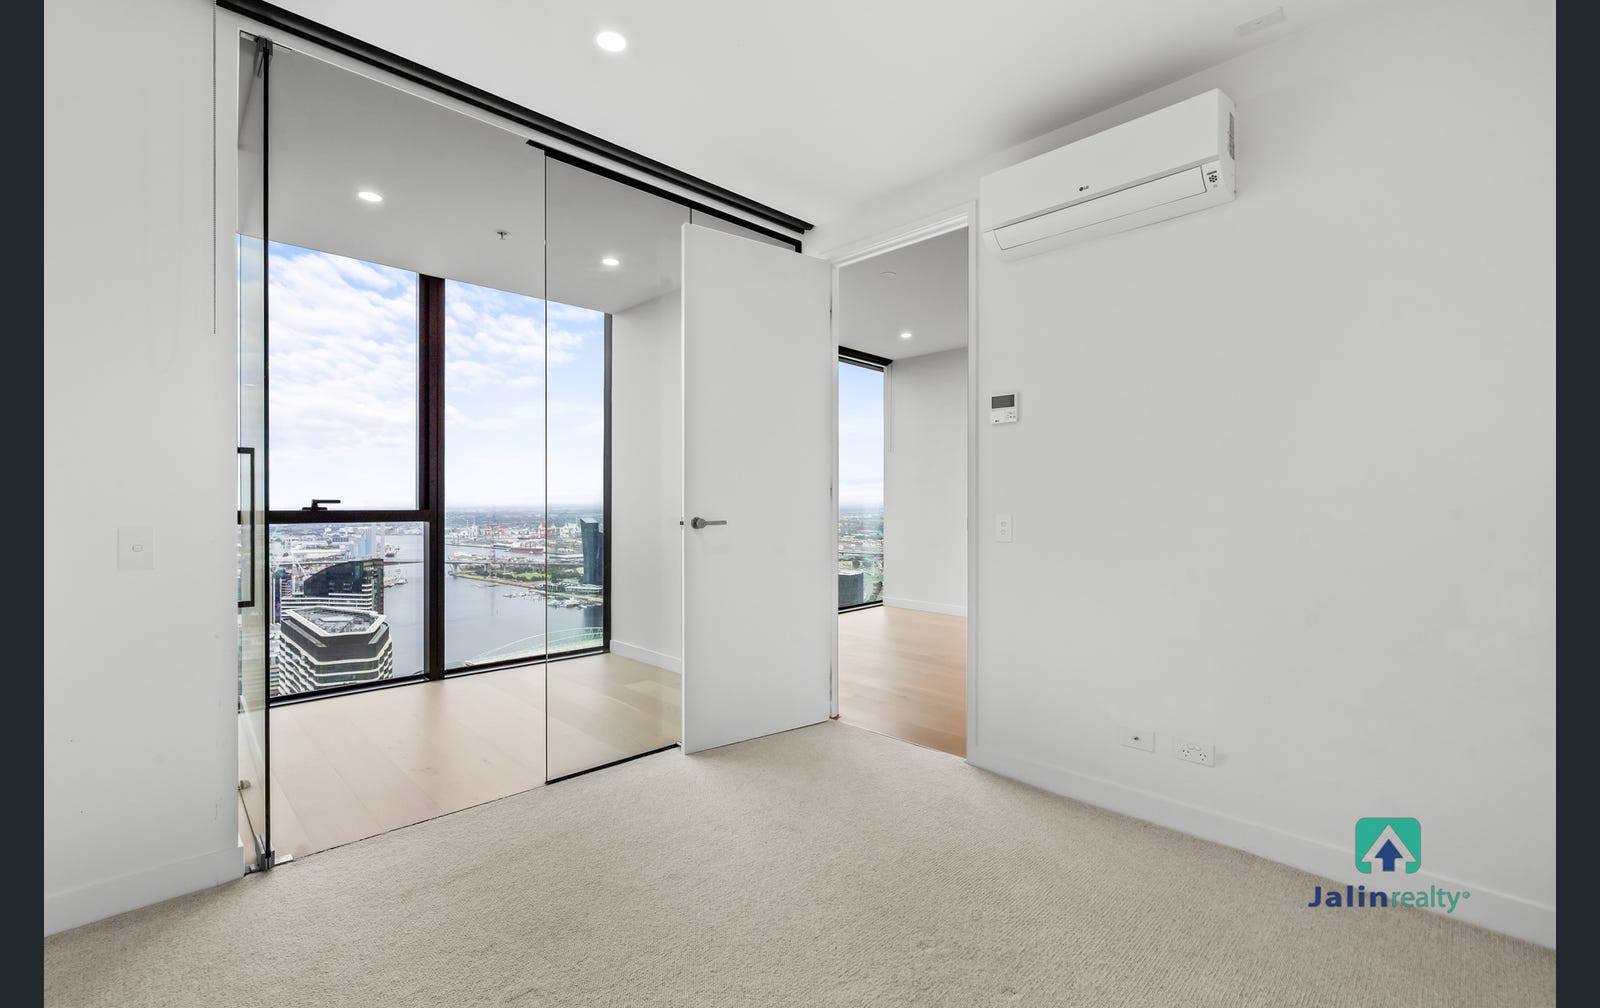
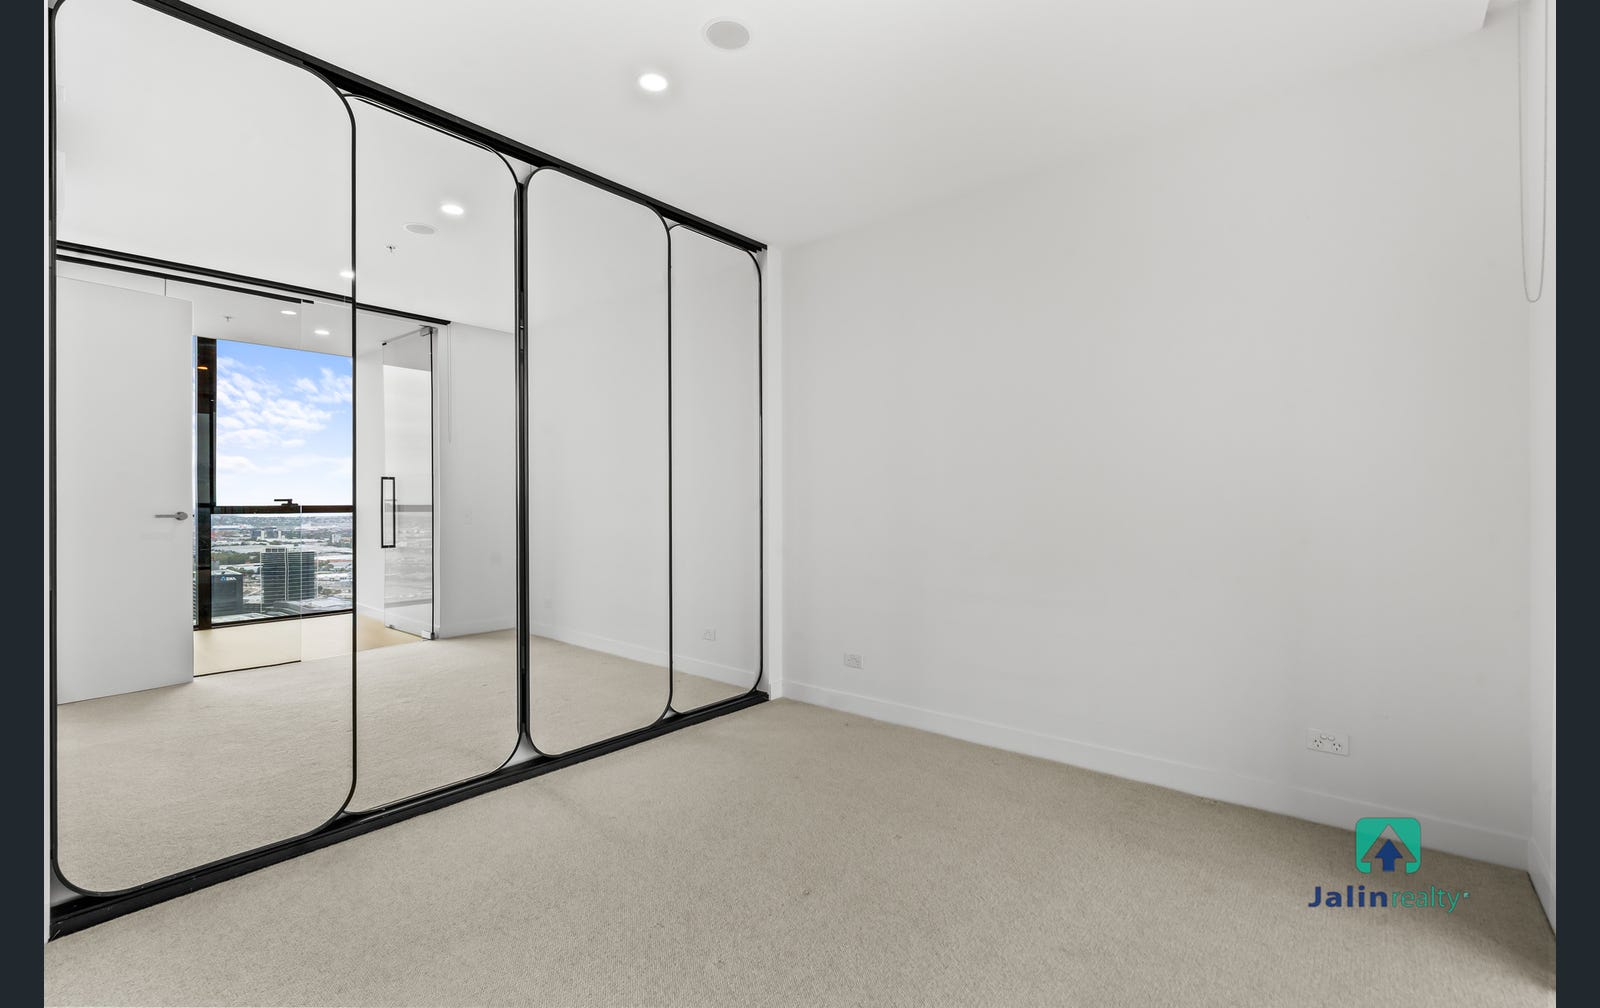
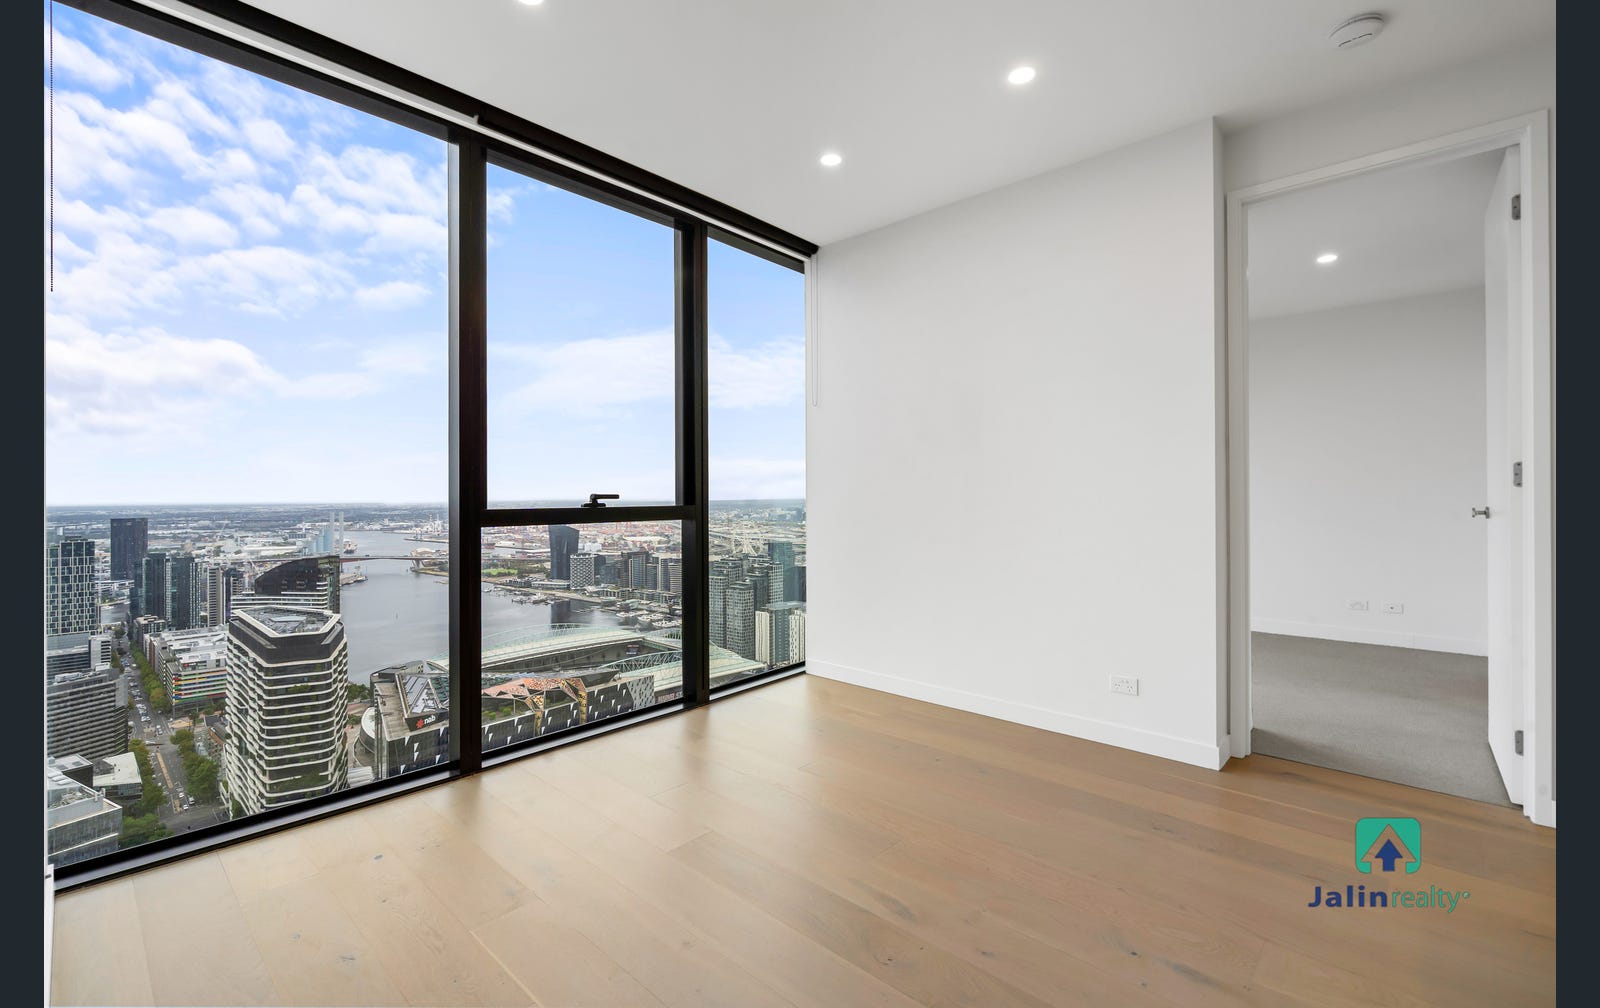
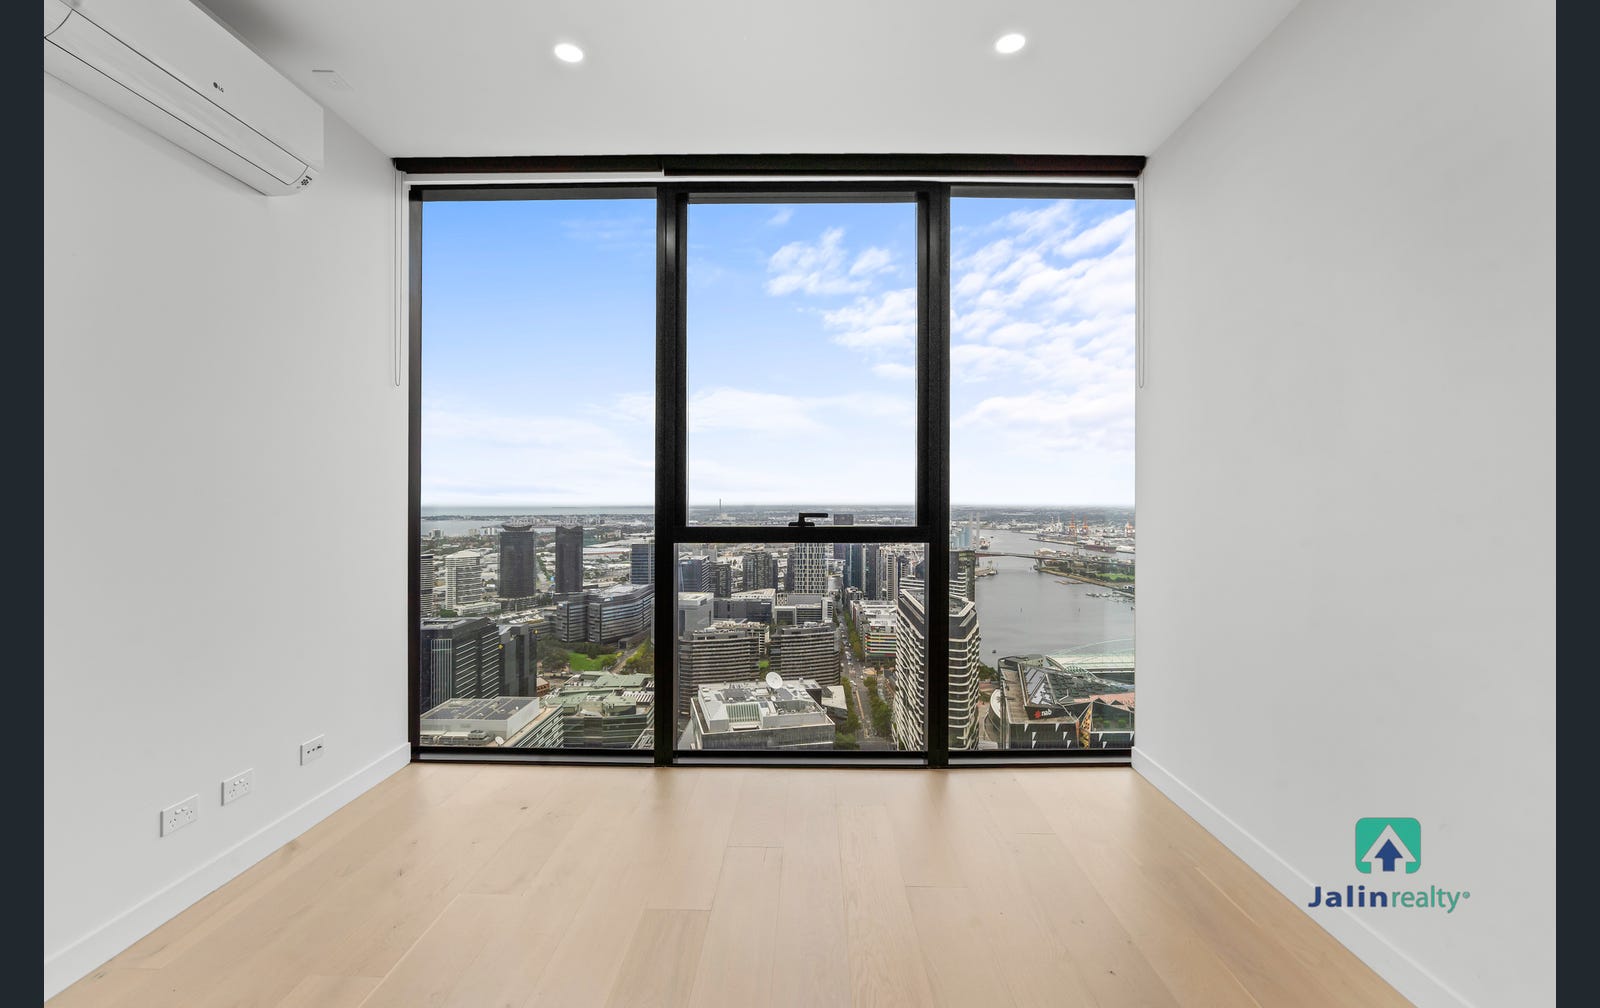
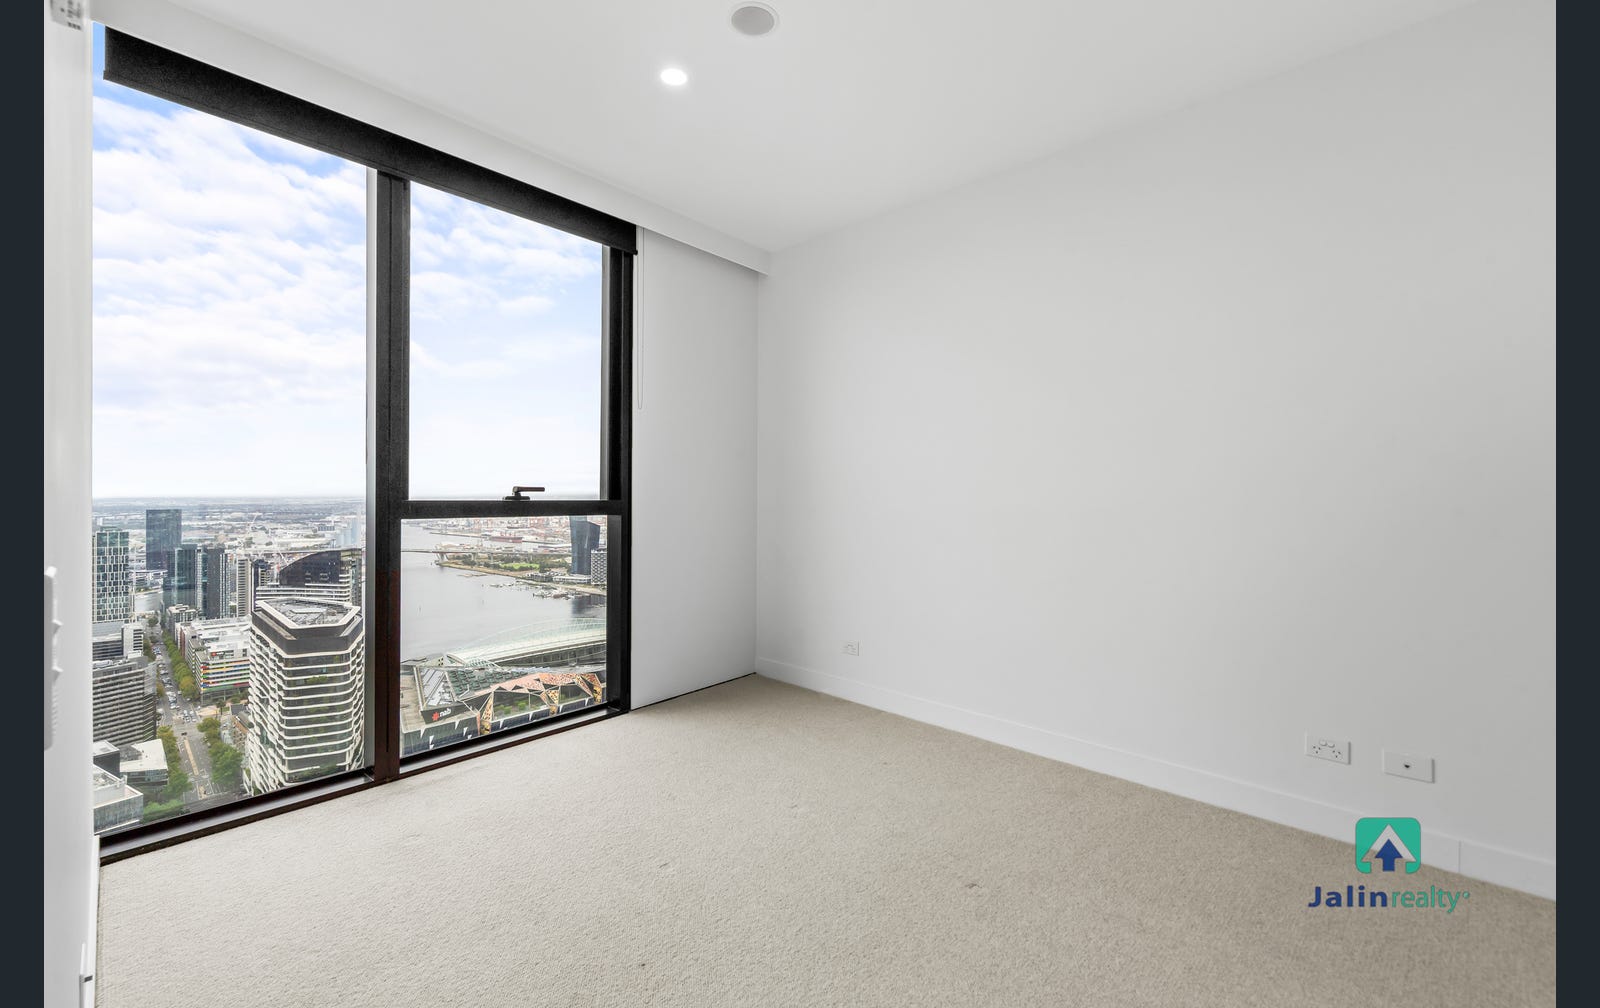
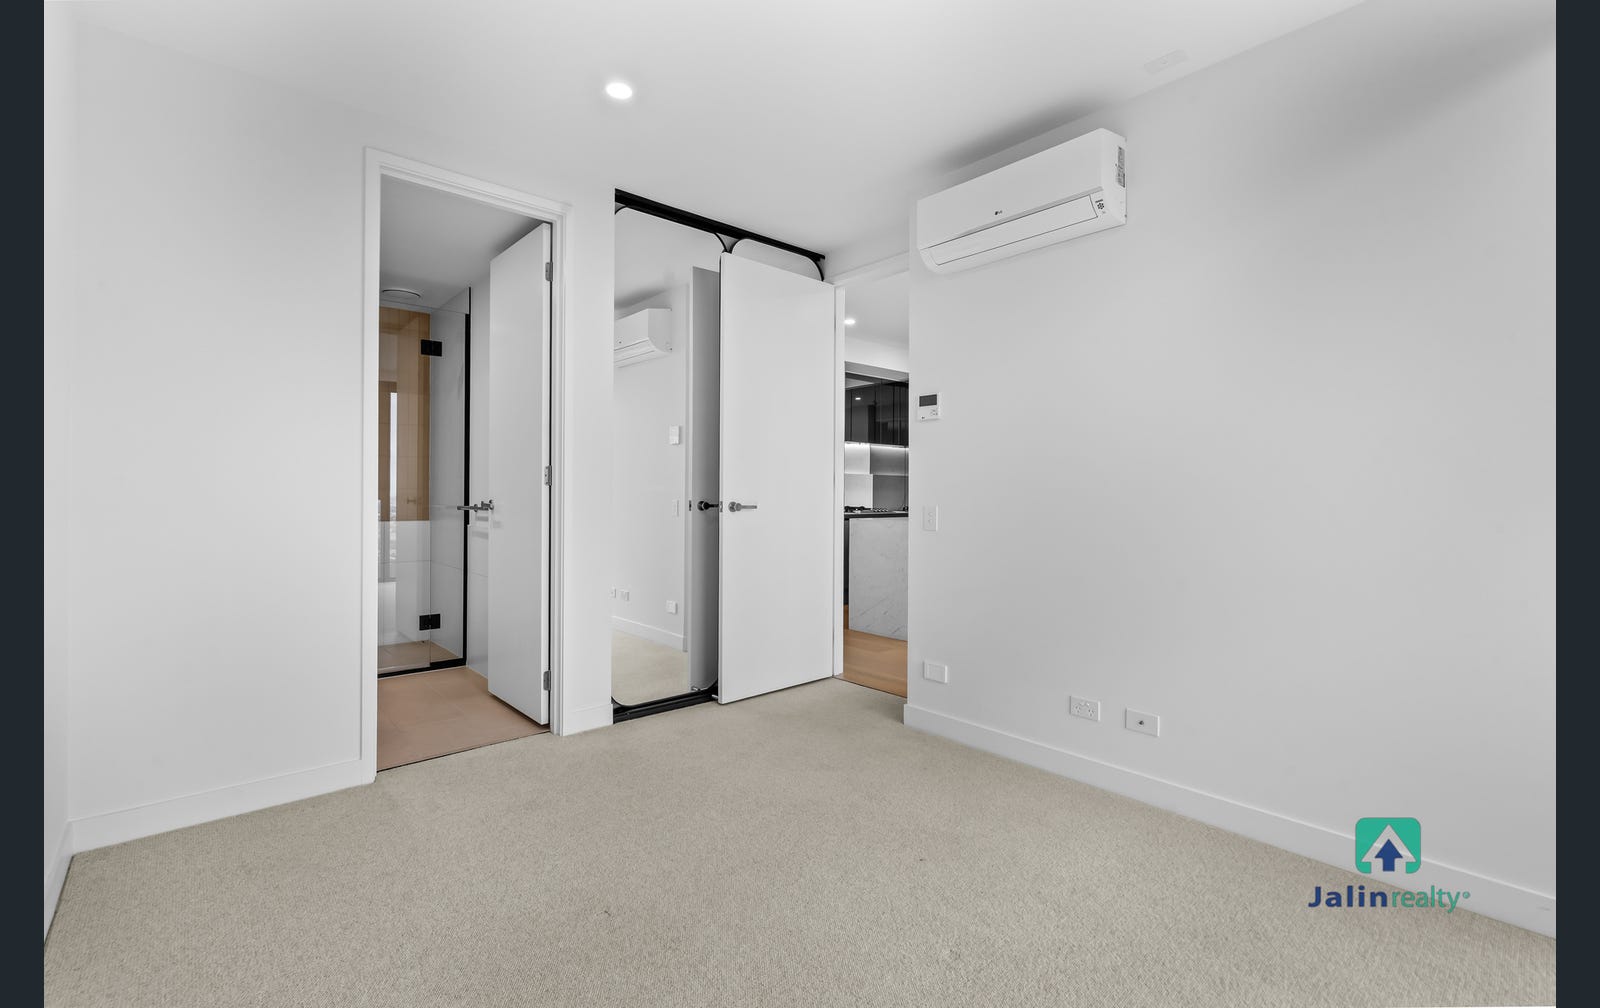
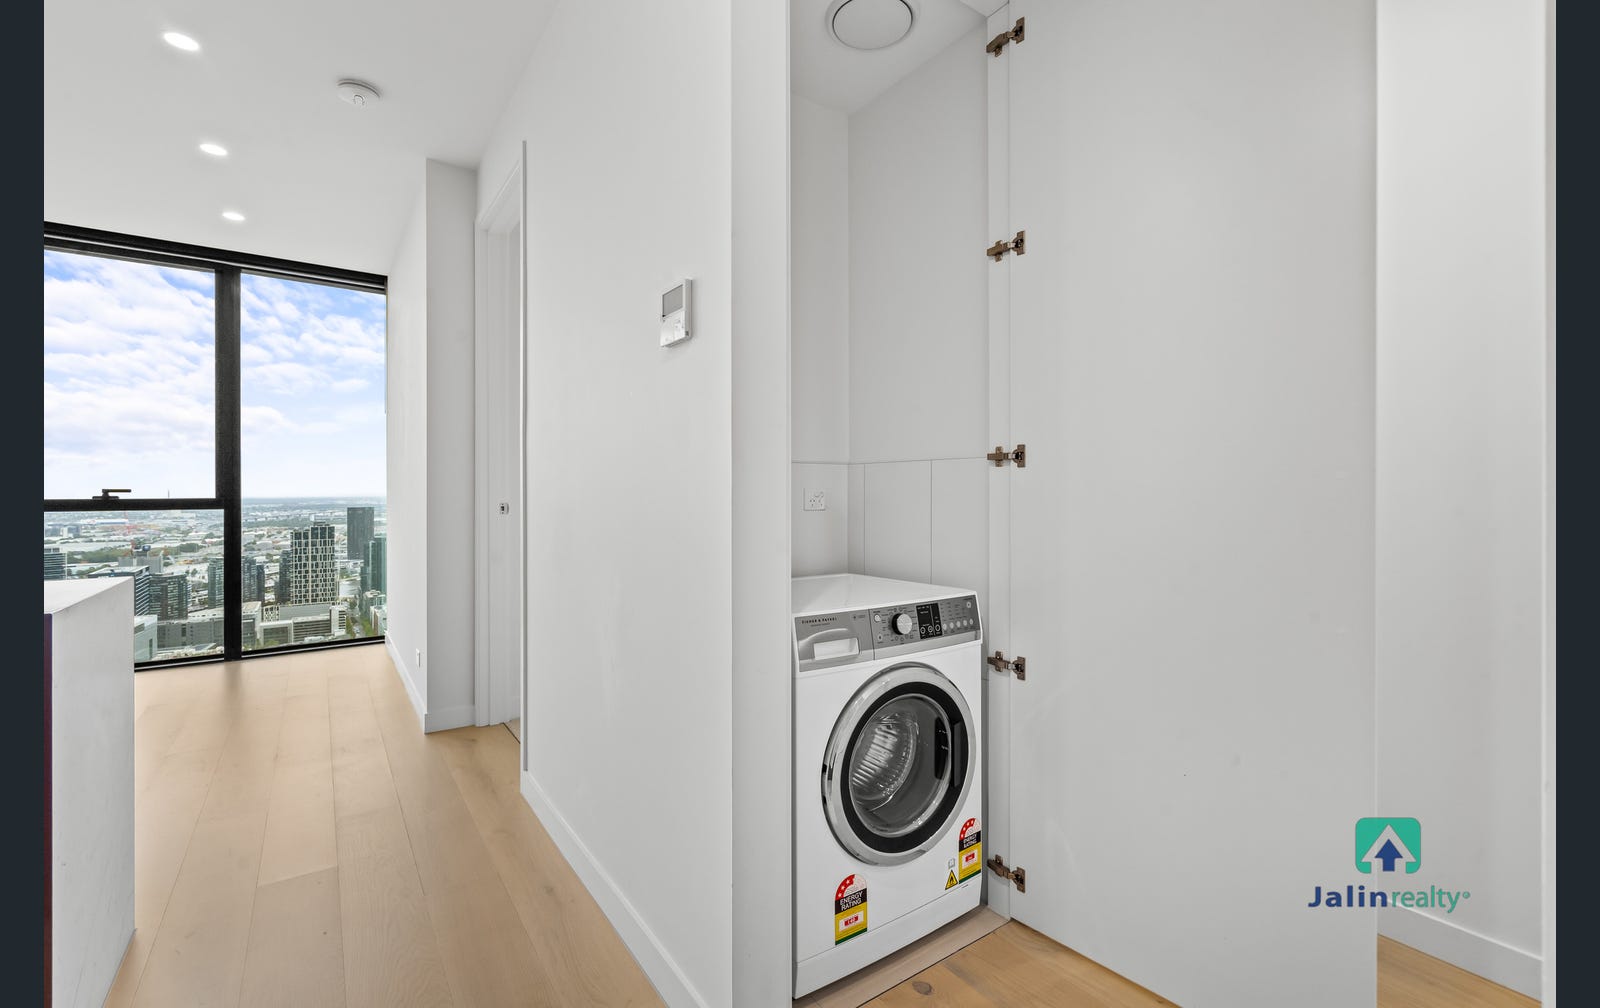
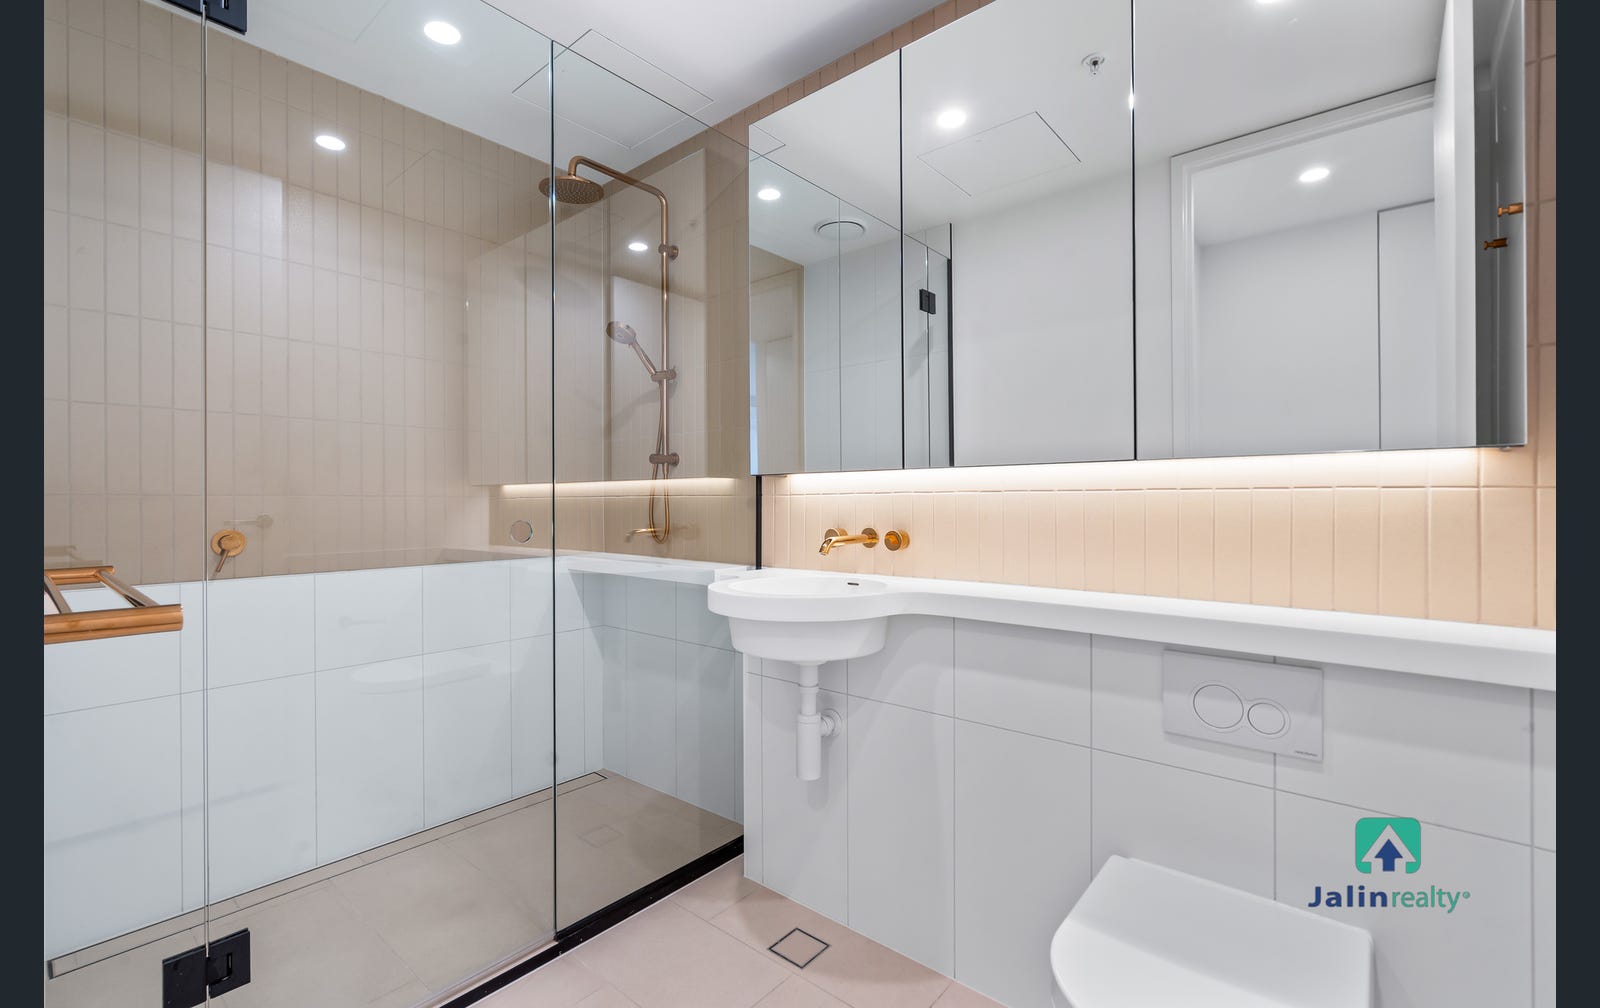
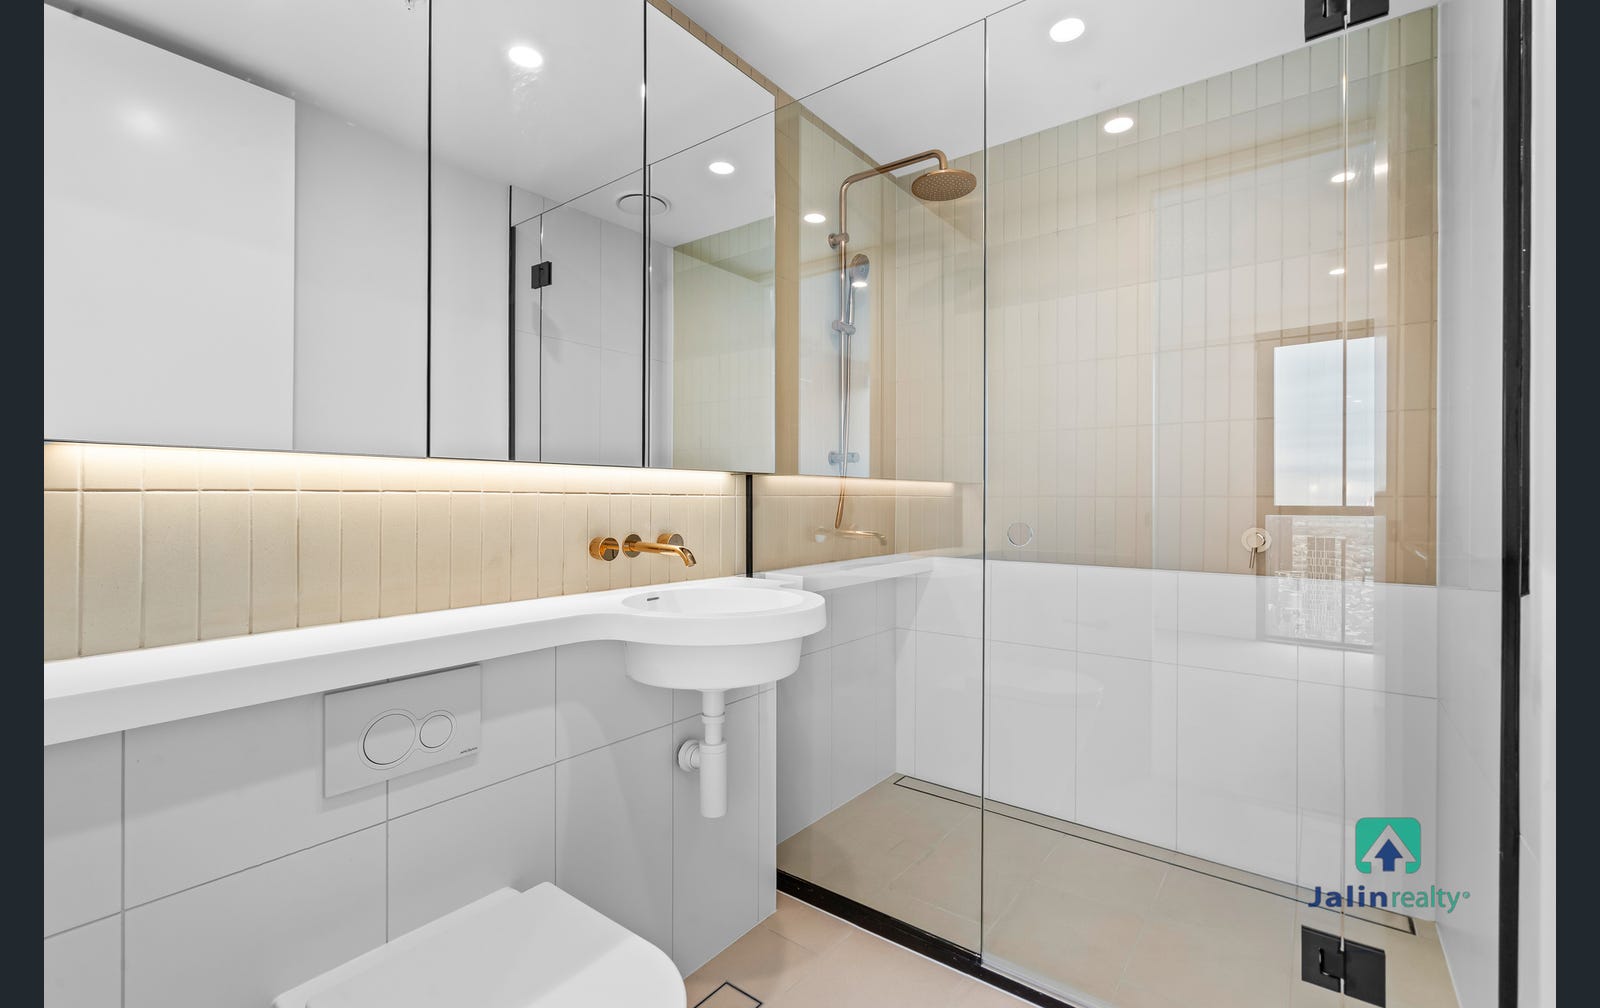
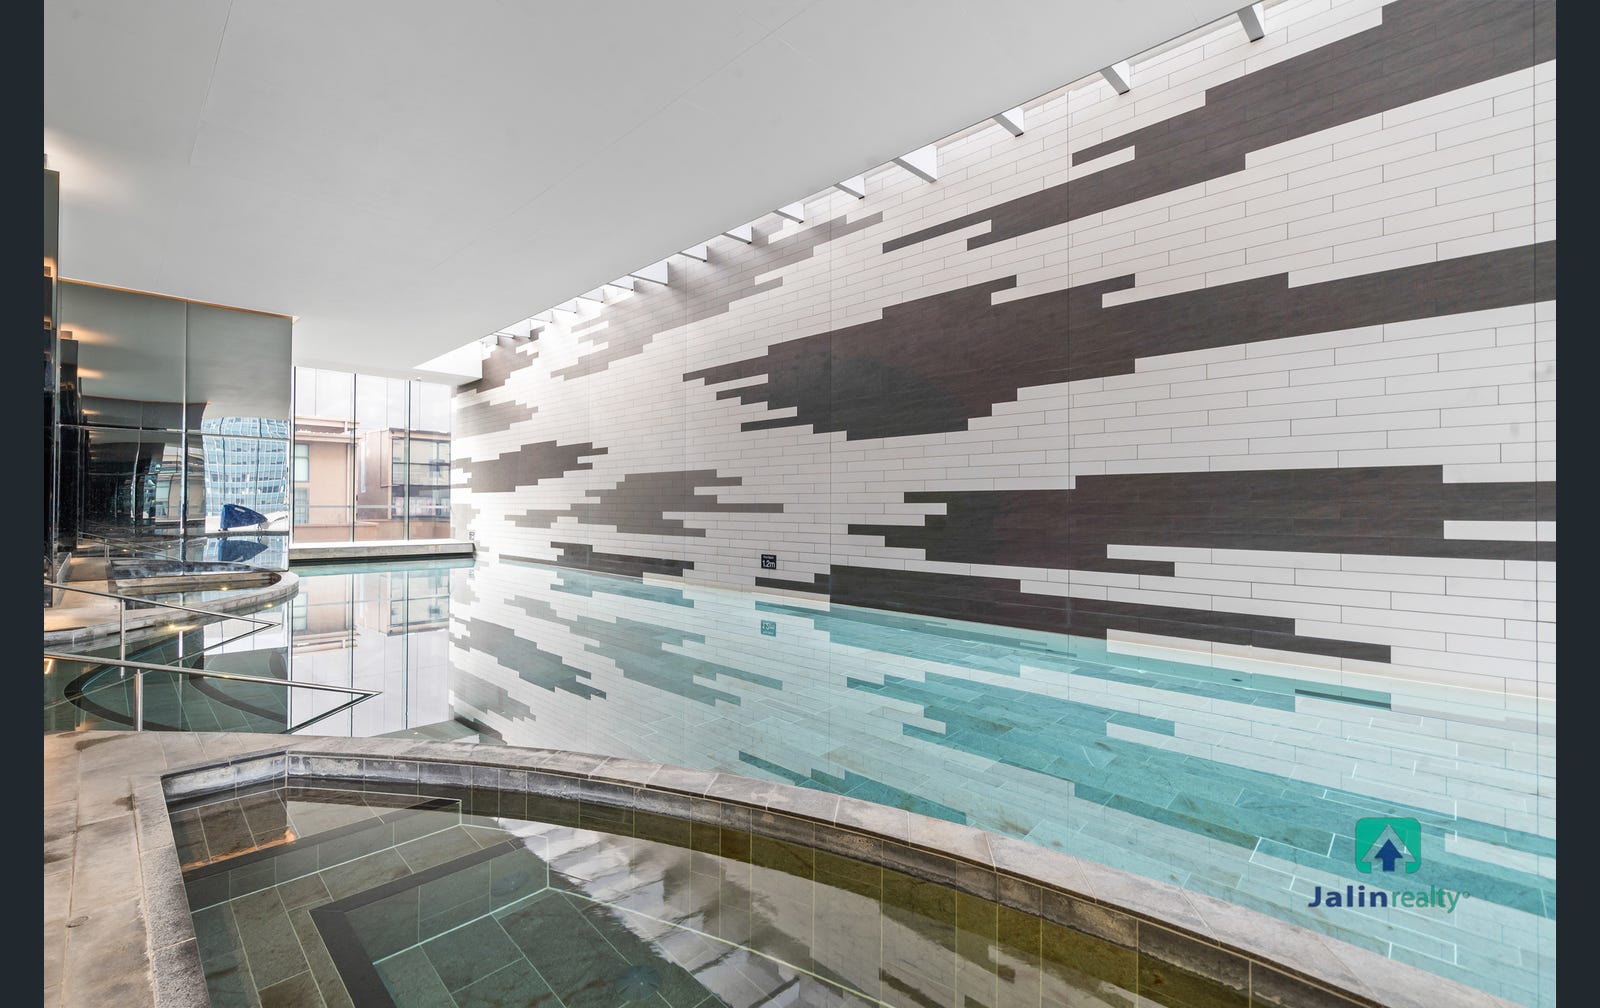
Eighteen interior & outlook photographs, plus a full interactive 360° walkthrough of the unit. The tour is best experienced full-screen — drag to rotate, scroll to move through the floorplan.
All Premier Tower disposals at level 39 and above between 13 May 2025 and 27 May 2026, as reported in the primary public sales register. The adjusted column re-prices each comparable to the subject's configuration (level 51, no car, 63 m²) at current market — applying car-space hedonic (−$75,000), level differential (+/− $2,500 per floor general; +/− $7,815 per floor for the "01" line corner stack, derived in-tower), and a time decay of −3.5% per annum based on observed in-building capital growth.
Unit
Settled
Level
Bd/Ba/Pk
Sale Price
Adjusted to U5101
Note
7101 ◆
13 May 2025
71
2/2/—
$1,069,700
$873,300
"01" line — primary anchor
3801 ◆
09 Jun 2025
38
2/2/1
$886,800
$815,600
"01" line — primary anchor
7207
22 Jan 2026
72
2/2/1
$1,033,300
$896,700
2BR/2BA most recent
7307
19 Aug 2025
73
2/2/1
$1,038,300
$882,900
2BR/2BA with car
7507
26 Jun 2025
75
2/2/—
$1,061,300
$967,300
upper 2BR — 07 corner
7406
08 Jul 2025
74
2/2/—
$1,040,200
$952,200
upper 2BR — 06 corner
6303
09 Oct 2025
63
2/2/0
$959,400
$909,000
2BR/2BA
6309
28 May 2025
63
2/2/—
$946,400
$883,400
2BR — 09 line
6207
08 Oct 2025
62
2/2/—
$898,600
$851,900
2BR/2BA
6107
19 Sep 2025
61
2/2/0
$893,600
$846,900
2BR/2BA
7602
10 Oct 2025
76
2/2/—
$815,300
$736,200
top-floor compact 2BR
6007
09 Oct 2025
60
2/2/0
$888,600
$847,000
2BR/2BA
6006
01 Sep 2025
60
2/2/0
$876,900
$832,900
2BR/2BA
6206
09 Sep 2025
62
2/2/0
$882,700
$833,800
2BR/2BA
6211
02 Sep 2025
62
2/2/—
$822,000
$774,600
2BR — 11 line compact
6306
18 Aug 2025
63
2/2/—
$887,700
$833,700
2BR — 06 corner
6106
30 Jul 2025
61
2/2/—
$881,900
$830,300
2BR — 06 corner
5906
19 May 2025
59
2/2/—
$876,100
$825,300
2BR — 06 corner
5805
20 Aug 2025
58
2/2/0
$872,940
$831,500
2BR/2BA
5503
19 Aug 2025
55
2/1/0
$877,500
$862,700
2BR/1BA — closest level
7503
14 Aug 2025
75
2/—/—
$666,700
$589,700
compact 2BR — different floorplan
7504
30 Sep 2025
75
2/—/—
$671,300
$596,000
compact 2BR — different floorplan
7502
29 Jul 2025
75
2/—/—
$713,800
$633,500
compact 2BR — different floorplan
7208
10 Jul 2025
72
2/—/—
$704,000
$631,300
compact 2BR — different floorplan
4311
02 Jun 2025
43
2/2/0
$690,000
$685,900
low outlier
7505
21 Oct 2025
75
1/1/0
$692,800
—
1BR · context only
7405
16 Oct 2025
74
1/1/0
$691,800
—
1BR · context only
7105
12 Nov 2025
71
1/1/0
$688,800
—
1BR · context only
6905
11 Nov 2025
69
1/1/0
$686,800
—
1BR · context only
6104
27 Nov 2025
61
1/1/1
$733,600
—
1BR with car · context
6204
21 Oct 2025
62
1/1/0
$649,200
—
1BR · context
7305
17 Sep 2025
73
1/—/—
$690,800
—
1BR · context
7404
10 Sep 2025
74
1/—/—
$670,300
—
1BR · context
7304
12 Aug 2025
73
1/—/—
$660,300
—
1BR · context
4202
04 Sep 2025
42
1/1/1
$704,800
—
1BR with car · context
7409
23 Jun 2025
74
1/1/0
$655,600
—
1BR · context
7205
16 Jun 2025
72
1/1/0
$689,800
—
1BR · context
7408
14 May 2025
74
1/—/—
$704,800
—
1BR · context
7203
13 May 2025
72
1/2/0
$664,000
—
1BR · context
3903
10 Dec 2025
39
1/1/0
$530,000
—
1BR · low-floor of register
6710
18 Sep 2025
67
1/1/0
$550,000
—
1BR · weak sale
7605
02 Oct 2025
76
1/—/—
$693,800
—
1BR · context
6404
26 May 2025
64
1/1/0
$658,617
—
1BR · context
7609
28 May 2025
76
1/1/1
$768,000
—
1BR with car · context
7407
25 Jun 2025
74
3/—/—
$940,800
—
3BR · segment differs
7607
13 Jun 2025
76
3/—/—
$1,091,300
—
3BR · segment differs
5101
— Subject —
51
2/2/0
to be set
this dossier
"01" line, level 51, 63 m²
— IV —
Method · Four Cross-Checks
Four independent angles. None is sufficient alone. Treated as cross-checks rather than convergent estimators — they all draw from the same underlying register and are therefore correlated. The role of multiple methods is to surface dispersion, not to validate a point estimate.
— Approach A · "01" Line direct anchor —
Same stack — presumed same floorplan
n=2 · small-sample caveat applies
Per-floor coefficient from 7101 vs 3801 spread (33 floors): $7,815 / floor Caveat: derived from n=2; standard error is large.
From 7101 (L71): $1,069,700 − 20×$7,815 = $913,400; ×0.965 time = $881,000 From 3801 (L38): $811,800 + 13×$7,815 = $913,400; ×0.968 time = $884,000 "01" line mean: $882,500
Approach B · Broad 2BR/2BA sample · adjusted
17 direct matches · level & time adjusted
Mean of 17 adjusted: $860,177 Median: $846,900 Trimmed mean (excl. high & low): $854,300
Approach C · Price per square metre
cross-check via $/m² · industry-standard normaliser
Inferred sqm of comps (Premier Tower standard floorplates): — "01" line corner 2BR: ~70 m² — "06/07" line corner 2BR: ~63-65 m² — "02/03/04/11" compact 2BR: ~55-58 m² Implied $/m² for upper register 2BR/2BA: $13,200 – $14,800 At midpoint $13,800/m² × 63 m² = $869,400 At lower bound $13,200/m² × 63 m² = $831,600 At upper bound $14,400/m² × 63 m² = $907,200 Caveat: sqm of comps inferred, not measured — see Section VI.
Approach D · Settlement-slippage adjustment
advertised prices typically 2 – 5% above settled in soft market
Public-register median of adjusted set: $854,300 Apply −3.5% settlement slippage haircut: ×0.965 ───────────────────────── = $824,400
Range of central estimates
honest dispersion — not a single point
A · "01" line: $882,500 B · broad sample median: $846,900 C · price-per-sqm midpoint: $869,400 D · settlement-adjusted: $824,400 ───────────────────────── Simple mean of four: $855,800 Implied range (min to max): $824,400 – $882,500
— Fair Value · Unit 5101 —
$855,000
— band of confidence · $820,000 to $890,000 —
Walk-Away Floor
$815,000
Target Sale
$855,000
Ambitious Ask
$895,000
— Bear · Contagion —
$795,000
Bottom-half freefall spreads up. Sub-tier sold $635K April 2026 vs $660K February 2026 = annualised −22%. If 30% of that contagion reaches the upper register over 90 days.
— Base —
$855,000
Four-method central estimate. Assumes current upper-register pricing holds with −3.5% p.a. ambient decay through campaign window.
— Bull · Tight Stack —
$895,000
Buyer specifically targets the "01" line corner. Premium paid for north-east aspect and exact floorplan match. Anchors to the higher 7101 print rather than the broad sample.
— V —
Disposition · Economics
At the base-case clearing price of $855,000, transaction costs absorb approximately $23,000 — selling commission 2.0%, marketing $4,000, conveyancing $1,800. Net cash proceeds approximate $832,000. The subject is held against a $473,000 senior mortgage; equity released on close approximates $359,000.
Gross Proceeds
$855,000
base case
Net to Vendor
$832,000
after costs
Equity Released
$359,000
after mortgage payoff
Versus the original acquisition price of $851,000, the base case clears effectively at par. Bear case ($795,000) yields equity release of approximately $300,000. Bull case ($895,000) yields approximately $399,000. The capital-at-risk gradient between bear and bull is therefore $100,000 — the principal range of negotiation leverage.
— VI —
Limitations · Adversarial Review
This dossier rests on a public-register dataset. It is materially less reliable than a sworn certified-practising-valuer report. Below is a candid inventory of structural weaknesses — investors should weigh these before treating any figure above as authoritative.
— Statistical fragility —
The $7,815 per-floor coefficient driving Approach A is derived from two data points. The standard error on that slope is large and unquantified. If either anchor was a motivated or distressed sale, the "01" line analysis collapses to n=1 and the central estimate could move materially in either direction.
— Unverified floorplan equivalence —
The "01" line same-stack assumption is inferred from unit numbering, not from cadastral plans. Premier Tower may have mirror or layout variations across the 33-floor span between the two anchors. Verifying this requires access to the building's title plan or developer floorplate documentation.
— Area inference not measurement —
Square-metre figures for comparables are inferred from Premier Tower standard floorplate conventions, not measured per unit. A single 5 m² mis-estimate at ~$13,800/m² shifts the implied value by approximately $70,000. This is the largest unaddressed variable in the model.
— Advertised vs settled —
Public-register prints are last-known advertised figures, not settlement-confirmed. Soft markets typically print 2–5% above settlement. Approach D captures this generically; instrument-grade settlement data would refine it.
— Bottom-half freefall signal —
Lower-register prints show an annualised pace of decline of approximately −22% over the most recent two-month window (April 2026 sale below February 2026 sale despite higher floor). If this contagion crosses the midpoint, the entire upper-register estimate moves down by 6 – 10% over the next 90 days. The bear scenario assumes 30% contagion transmission.
— Survivorship —
The register shows what sold. It does not show what was withdrawn, passed in at auction, or relisted at lower prices. The current building "for sale" register shows ten listings — modest supply overhang exists. The market may be thinner than closed-sale velocity implies.
— Subject-specific factors not captured —
Aspect, view orientation, finish, furnishing, current owners-corporation fees, days-on-market for the subject itself, and any building-defect status (cladding rectification, structural matters) are not modelled. Each can move the achieved price by ±$30,000.
— Recommended verification —
Cross-validate against settlement-grade paid data sources. Commission a sworn certified-practising-valuer report (approximate cost A$500) before the Statement of Information is finalised under the Estate Agents Act 1980 (Vic). Treat figures above as a structured opening posture rather than as a binding valuation.